RStudio IDE (Integrated Development Environment)
Learning Objectives
- Introduce participants to the RStudio interface: Panes, Buttons, and Shortcuts
- To be able to create self-contained projects in RStudio
- Create workshop project and download gapminder data
- Introduce R syntax
- Point to relevant information on how to get help, and understand how to ask well formulated questions
Introduction
Why R?
R is a free, open-source programming/scripting language, inspired by the programming language S. It can do most things that any programming language can do, but it was designed for data analysis and statistics, which is why we teach it. It has a huge user-community and is highly extensible, with over 7,000 packages that build extra functionality at the official Comprehensive R Archive Network. For almost anything you want to do, there is an R package to help.
Why RStudio?
RStudio is an IDE (integrated development environment) which we use to manage and execute R code. It is also free and open-source, it works on all platforms (e.g. you can interface to Amazon Web Services using RStudio), and it integrates version control and project management.
Why script?
Folks who write scripts often do so for a myriad of reasons. More often than not, GUI interfaces fail to allow one to harness the full power of a software or analysis environment. Additionally, with a GUI interface, you are constrained to the functions the programmer has written in. But analysis environments that have a console or shell, like Stata, MATLAB, R, and Python, give you the best of both worlds, including
- Power: More control than the GUI
- Flexibility: Do analyses as you’d like
- Editability: Error fixing, tweaks
- Traceability: Return and know what was done
- Reproducibility: Allowing your later self and others to repeat work
- Sharability: No ambiguity in communicating code, data, and results
Introduction to RStudio
Let’s take a look at the RStudio IDE. We see 3 panels:
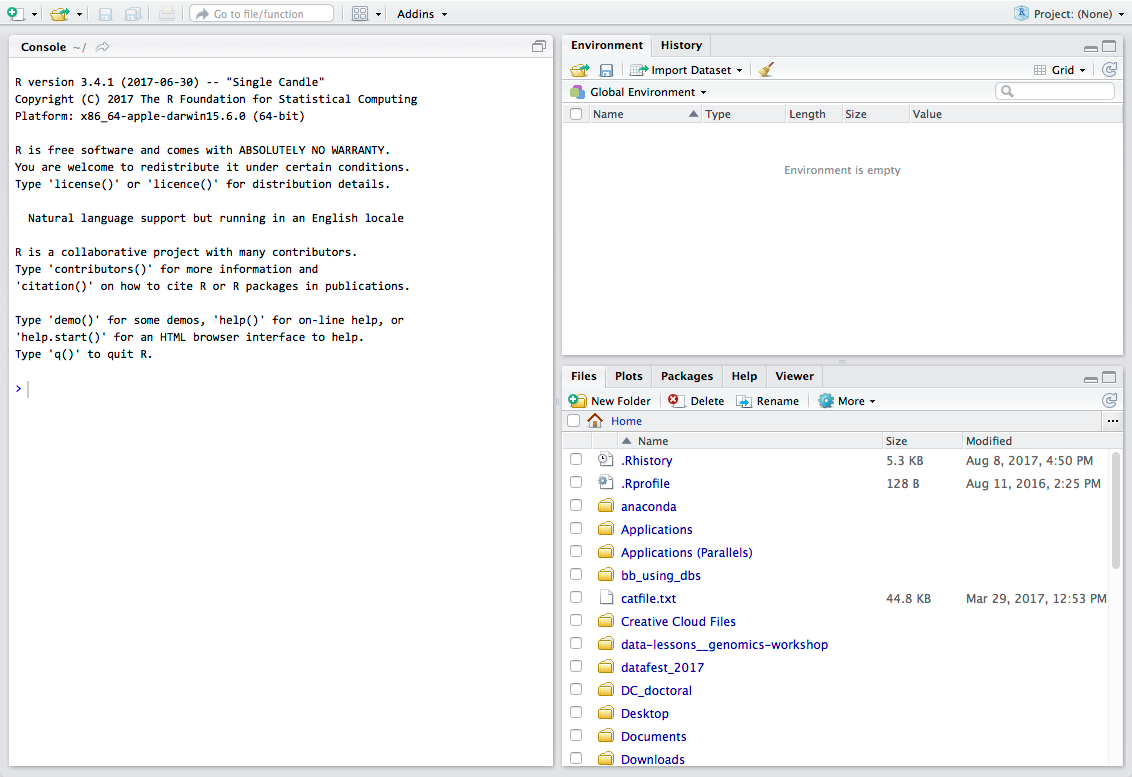
- The interactive R console (entire left)
- Workspace/History (tabbed in upper right)
- Files/Plots/Packages/Help (tabbed in lower right)
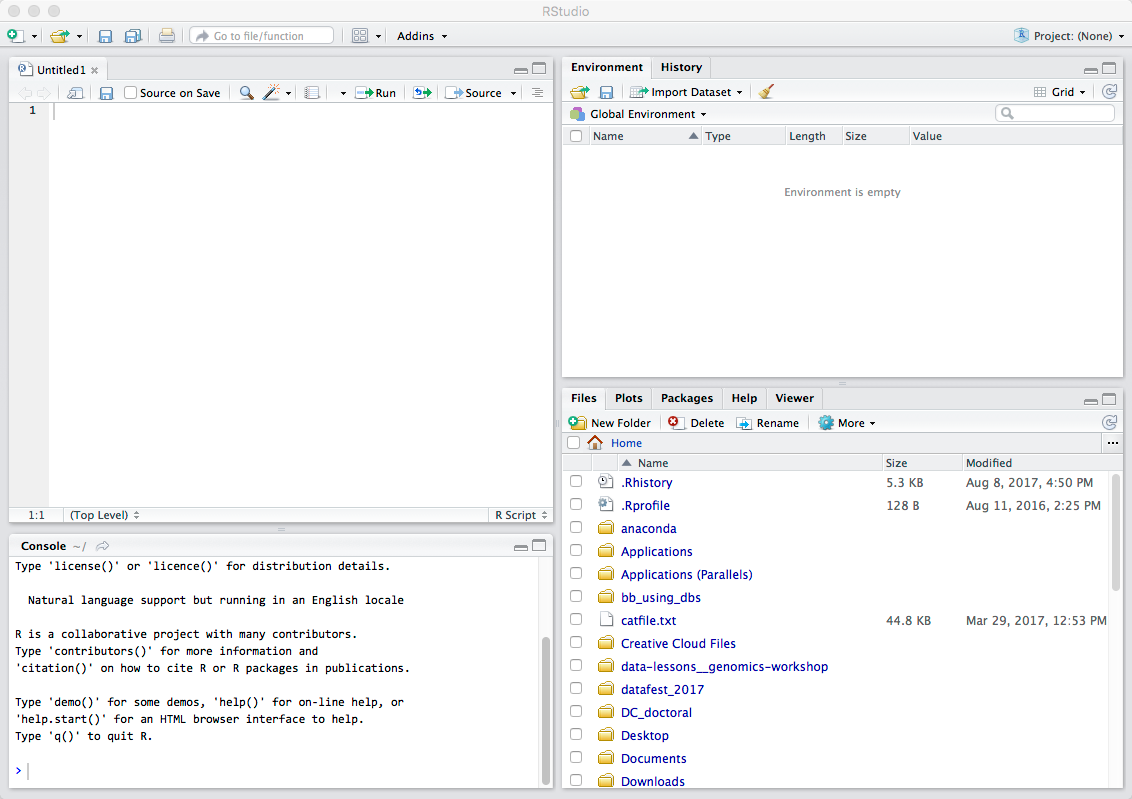
A 4th panel will appear at the top portion of the console panel when working on a script, markdown document, or some other user-controlled file:
Workflow within RStudio
Console vs. Script
- Console
- The R console is where all of your code gets run. This console in RStudio is the same as the one you would get if you just typed in
Rin your command line. - When you start RStudio, you’ll see a bunch of information, followed by a “>” and a blinking cursor. This is a “Read, evaluate, print loop”: you type in commands, R executes them and returns a result.
- Demo R-as-calculator in console
- History is saved, but this is laborsome
- The R console is where all of your code gets run. This console in RStudio is the same as the one you would get if you just typed in
- Script
- Preserve work in a plain-text file (with .R extension)
- Create new R script
- Fourth RStudio panel.
- Command/ctrl-enter to push current line
- Mixes interactivity and preservation
- Save just text and get same results
- Building preservable flow of operations
Tip: Pushing to the interactive R console
To run the current line click on the
Runbutton just above the file pane. Or use the short cut which can be seen by hovering the mouse over the button.To run a block of code, select it and then
Run.Select-all and
Run– moving toward a model where we run whole script.
Organizing yourself and your work
The scientific process is naturally incremental, and many projects start life as random notes, some code, then a manuscript, and eventually everything is a bit mixed together.
Managing your projects in a reproducible fashion doesn’t just make your science reproducible, it makes your life easier.
— Vince Buffalo (@vsbuffalo) April 15, 2013
Most people tend to organize their projects like this:
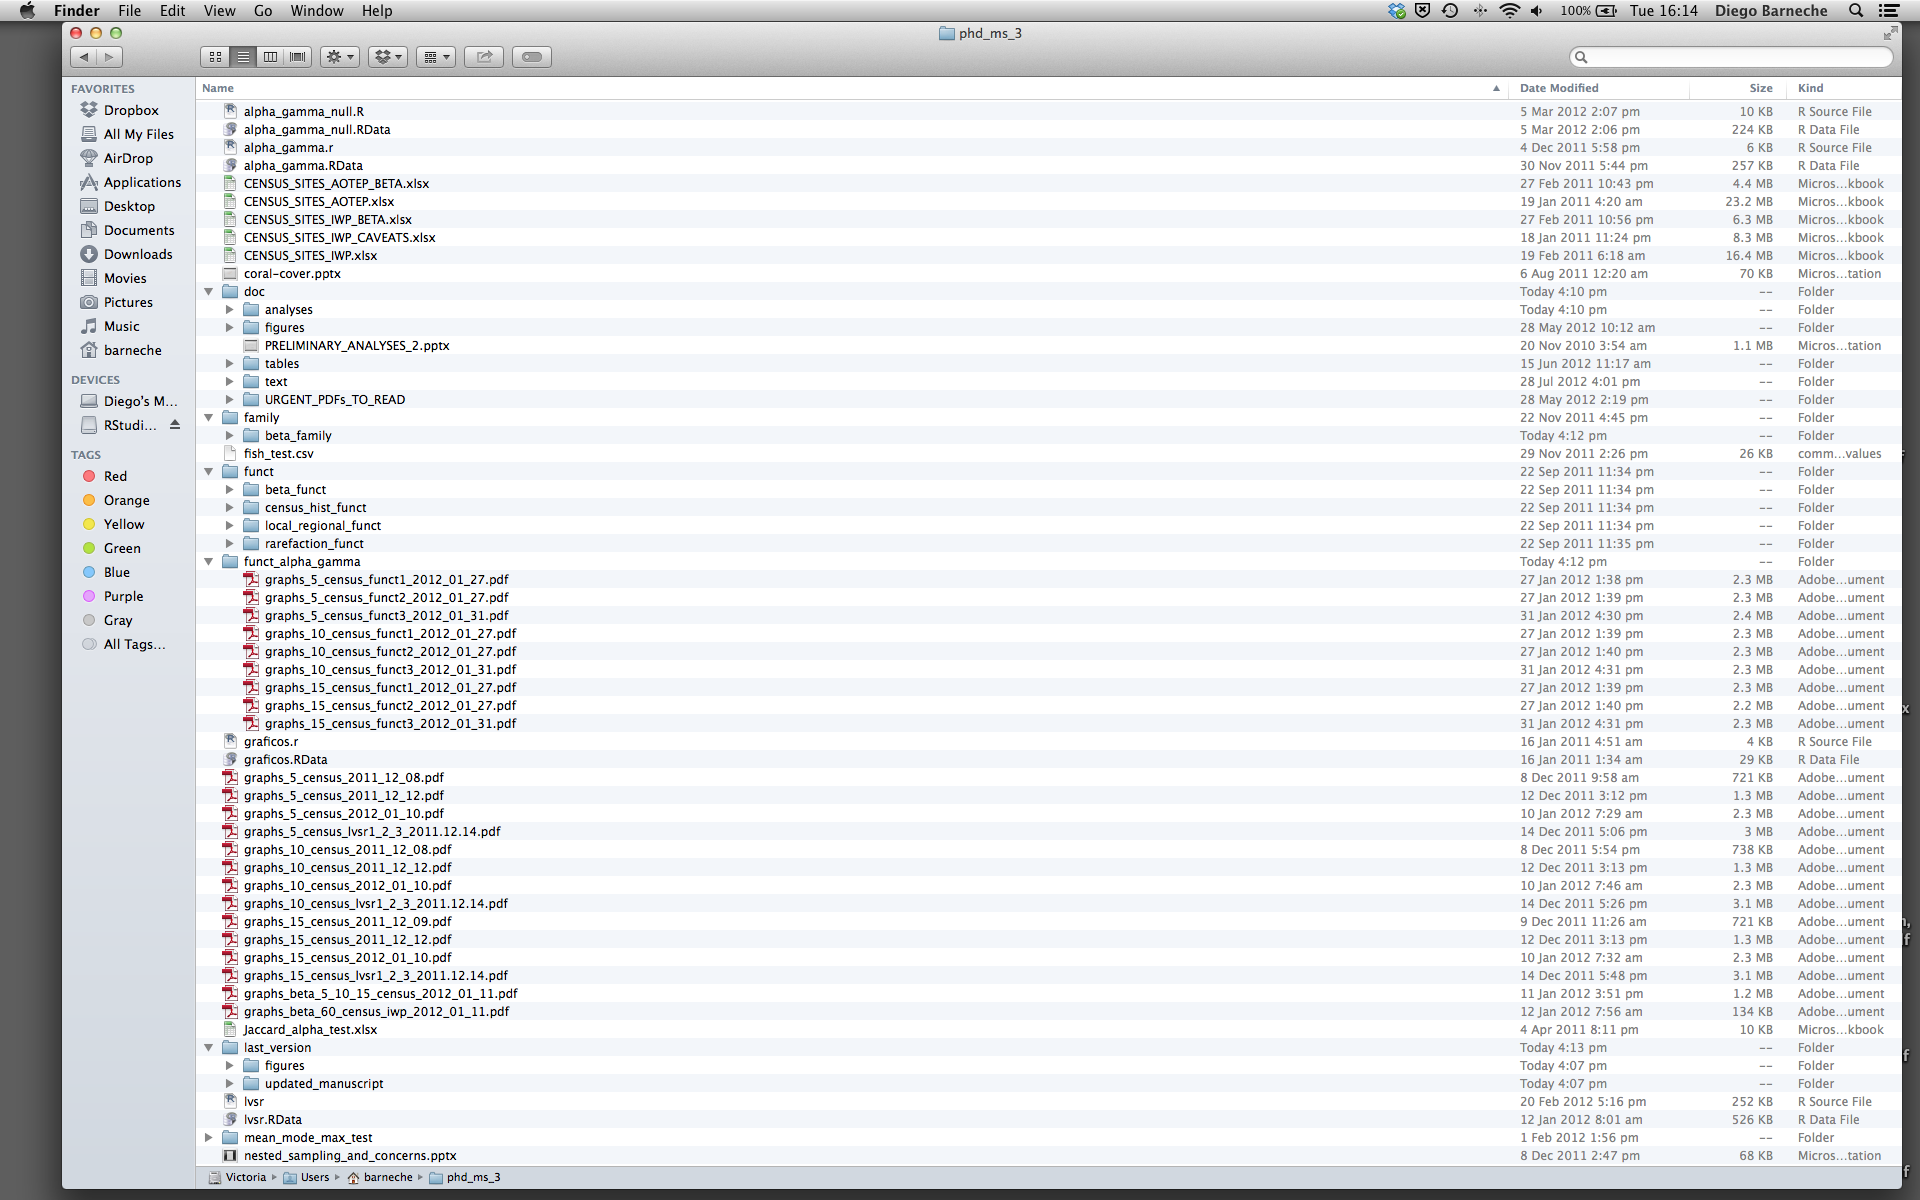
There are many reasons why we should ALWAYS avoid this:
- It is really hard to tell which version of your data is the original and which is the modified;
- It gets really messy because it mixes files with various extensions together;
- It probably takes you a lot of time to actually find things, and relate the correct figures to the exact code that has been used to generate it;
A good project layout will ultimately make your life easier:
- It will help ensure the integrity of your data;
- It makes it simpler to share your code with someone else (a lab-mate, collaborator, or supervisor);
- It allows you to easily upload your code with your manuscript submission;
- It makes it easier to pick the project back up after a break.
It is good practice to keep a set of related data, analyses, and text self-contained in a single folder, called the working directory. All of the scripts within this folder can then use relative paths to files that indicate where inside the project a file is located (as opposed to absolute paths, which point to where a file is on a specific computer). Working this way makes it a lot easier to move your project around on your computer and share it with others without worrying about whether or not the underlying scripts will still work.
RStudio provides a helpful set of tools to do this through its “Projects” interface, which not only creates a working directory for you but also remembers its location (allowing you to quickly navigate to it) and optionally preserves custom settings and open files to make it easier to resume work after a break. Below, we will go through the steps for creating an “R Project” for this tutorial.
Challenge – Creating a Project
We’re going to create a new project in RStudio:
- Click the “File” menu button, then “New Project”.
- Click “New Directory”.
- Click “Empty Project”.
- Type a descriptive directory name: This is the title of yoru project, e.g. “Doctoral_Workshop”.
- Store the new directory in a sensable place in your computer’s organizational scheme.
- Click “Create Project”.
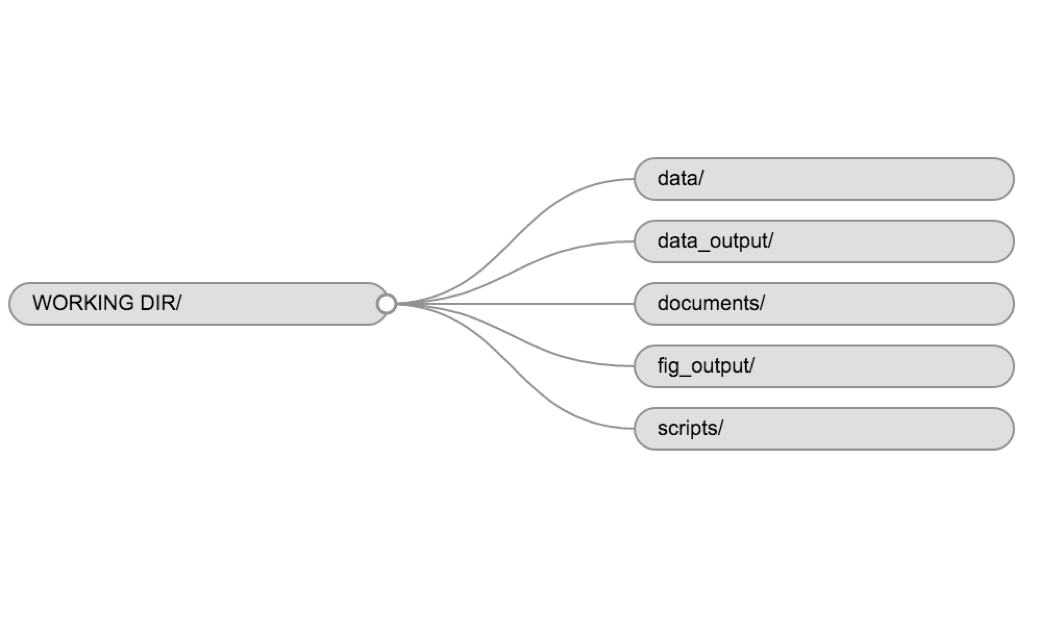
Your working directory should now look like this:
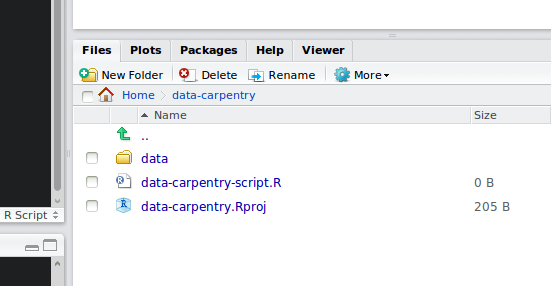
Now when we start R in this project directory, or open this project with RStudio, all of our work on this project will be entirely self-contained in this directory.
Project organization & Best Practices
Using a consistent folder structure across your projects will help keep things organized, and will also make it easy to find/file things in the future. This can be especially helpful when you have multiple projects. In general, you may create directories (folders) for scripts, data, and documents.
data/Use this folder to store your raw data and intermediate datasets you may create for the need of a particular analysis. For the sake of transparency and provenance, you should always keep a copy of your raw data accessible and do as much of your data cleanup and preprocessing programmatically (i.e., with scripts, rather than manually) as possible. Separating raw data from processed data is also a good idea. For example, you could have files data/raw/tree_survey.plot1.txt and …plot2.txt kept separate from a data/processed/tree.survey.csv file generated by the scripts/01.preprocess.tree_survey.R script.documents/This would be a place to keep outlines, drafts, and other text.scripts/This would be the location to keep your R scripts for different analyses or plotting, and potentially a separate folder for your functions (more on that later).
You may want additional directories or subdirectories depending on your project needs, but these should form the backbone of your working directory. For this workshop, we will need a data/ folder to store our raw data, and we will create later a data_output/ folder when we learn how to export data as CSV files.
Although there is no “best” way to lay out a project, there are some general principles to adhere to that will make project management easier:
Treat raw data as read only
This is probably the most important goal of setting up a project. Data is typically time consuming and/or expensive to collect. Working with them interactively (e.g., in Excel) where they can be modified means you are never sure of where the data came from, or how it has been modified since collection. It is therefore a good idea to treat your data as “read-only”.
Treat generated output as disposable
Anything generated by your scripts should be treated as disposable: it should all be able to be regenerated from your scripts.
There are lots of different was to manage this output. I find it useful to have an output folder with different sub-directories for each separate analysis. This makes it easier later, as many of my analyses are exploratory and don’t end up being used in the final project, and some of the analyses get shared between projects.
Separate function definition and application
The most effective way I find to work in R, is to play around in the interactive session, then copy commands across to a script file when I’m sure they work and do what I want. You can also save all the commands you’ve entered using the history command, but I don’t find it useful because when I’m typing its 90% trial and error.
When your project is new and shiny, the script file usually contains many lines of directly executed code. As it matures, reusable chunks get pulled into their own functions. It’s a good idea to separate these into separate folders; one to store useful functions that you’ll reuse across analyses and projects, and one to store the analysis scripts.
A possible organization scheme
- data
- scripts
- results
- papers
- figures
Download gapminder data to the data directory
Now we will create a good directory structure and save the data file in the data/ directory.
Challenge – Project Organization
- In your project directory, either using the Project tab of RStudio or your OS’ file system, create the following directories:
- data
- scripts
- results
- figures
- Files with the .RDA extension are R-Data files. Right-click on this link to “save file as …”
- Save the
continents.RDAfile to thedata/directory in your project - Save gapminder-FiveYearData.csv to the
data/directory in your project
We will load and inspect this dataset in the next section.
Basics
The Console
You can get output from R simply by typing math in the console:
12 / 7We can also comment on what we’re doing:
# I am adding 3 and 5. R is fun!
3 + 5
What happens if we do that same command without the # sign in the front?
I am adding 3 and 5. R is fun?
3 + 5
Now R is trying to run that sentence as a command, and it doesn’t work.
What if we replace the hash # with a double quote "
" I am adding 3 and 5. R is fun?
3 + 5
Now we’re stuck over in the console. The + sign means that it’s still waiting for input, so we can’t type in a new command. To get out of this type Esc. This will work whenever you’re stuck with that + sign.
It’s great that R is a glorified caluculator, but obviously we want to do more interesting things. To do useful and interesting things, we need to assign values to variables. To create variables, we need to give it a name followed by the assignment operator <- and the value we want to give it…
Challenge
What is 22 divided by 7?
Variables and Assignment
For instance, instead of adding 3 + 5, we can assign those values to variables and then add them.
# Assign 3 to a.
a <- 3
# Assign 5 to b.
b <- 5

# What is a?
a
# What is b?
b

# Add a and b.
a + b
<- is the assignment operator. It assigns a value on the right to a variable name on the left. So, after executing x <- 3, the value of x is 3. The arrow can be read as 3 goes into x. You can also use = for assignments but not in all contexts so it is good practice to use <- for assignments. = should only be used to specify the values of arguments in functions.
In RStudio, typing Alt - (push Alt, the key next to your space bar at the same time as the - key) will write <- in a single keystroke.
When assigning a value to an variable, R does not print anything. You can force R to print the variable’s value by using parentheses:
(s <- "hi")or by typing the variable’s name:
s <- "hi"
s
Challenge
To get comfortable with variables and assignment, let’s use R to do some unit conversions.
Suppose you’re thinking about running a 5 kilometer race and you want to know how many miles that is. Let’s create a variable
distance_kmand assign it the value5.Now create a new variable
miles_per_kmand assign it the value0.621371(there are 0.621371 miles in a kilometer).Given these two variables, create a third variable named
distance_milesthat contains the number of miles in the race.Inspecting your newest variable, you should see that a 5 kilometer race is a little longer than three miles.
Now suppose you did really well in the 5k and you want to run a 10k. Assign the value
10to the variabledistance_km. What is stored in thedistance_milesvariable now?
Functions and Function Arguments
The other key feature of R are functions. R has many built-in functions. Some examples of these are mathematical functions, like sqrt and round. You can also get functions from libraries (which we’ll talk about in a bit), or even write your own.
Functions are “canned scripts” that automate something complicated or convenient or both. Many functions are predefined, or become available when using the function library (more on that later). A function usually gets one or more inputs called arguments. Functions often (but not always) return a value. A typical example would be the function sqrt. The argument (the input) must be a number, and the return value (the output) is the square root of that number. Executing a function (running it) is called calling the function. An example of a function call is:
a <- 2
sqrt(a)
Here, the value of a is given to the sqrt function, the sqrt function calculates the square root.
The return value of a function need not be numerical (like that of sqrt), and it also does not need to be a single item: it can be a set of things, or even a data set. We’ll see that when we read data files in to R.
Arguments can be anything, not only numbers or filenames, but also other variables. Exactly what each argument means differs per function, and must be looked up in the documentation. If an argument alters the way the function operates, such as whether to ignore missing values, such an argument is sometimes called an option.
Most functions can take several arguments, but many have so-called defaults. If you don’t specify such an argument when calling the function, the function itself will fall back on using the default. This is a standard value that the author of the function specified as being “good enough in standard cases”. An example would be what symbol to use in a plot. However, if you want something specific, simply change the argument yourself with a value of your choice.
Let’s try a function that can take multiple arguments round:
round(3.14159)The return value from this function call is 3. That’s because the default is to round to the nearest whole number. If we want more digits we can see how to do that by getting information about the round function. We can use args(round) to see what arguments this function takes:
args(round)Or we can look at the help file for this function using ?round or help(round):
?round
help(round)
We see that if we want a different number of digits, we can type digits = 2 or however many we want.
round(3.14159, digits = 2)If you provide the arguments in the exact same order as they are defined you don’t have to name them:
round(3.14159, 2)However, it’s usually not recommended practice because it’s a lot of remembering to do, and if you share your code with others that includes less known functions it makes your code difficult to read. It’s fine to not include the names of the arguments for basic functions like mean, min, and others.
Another advantage of naming arguments, is that the order doesn’t matter. This is useful when there start to be more arguments.
Challenge
What arguments does the
abs()function take? What does it return? What isabs(-1)?
Naming Variables and Functions
Variables can be given any name such as x, current_temperature, or subject_id. You want your variable names to be explicit and not too long. They cannot start with a number (2x is not valid but x2 is). R is case sensitive (length_mb is different from length_MB). There are some names that cannot be used because they represent the names of fundamental functions in R (if, else, for, …). See here for a complete list of reserved keywords. In general, even if it’s allowed, it’s best to not use other function names (c, T, mean, data, df, weights, …). In doubt check the help to see if the name is already in use. It’s also best to avoid dots (.) within a variable name as in my.dataset. There are many functions in R with dots in their names for historical reasons, but because dots have a special meaning in R (for methods) and other programming languages, it’s best to avoid them. It is also recommended to use nouns for variable names, and verbs for function names. It’s important to be consistent in the styling of your code (where you put spaces, how you name variables, …). In R, two popular style guides are Hadley Wickham’s and Google’s.
Vectors and Data Types
A vector is the most common and basic data structure in R, and is pretty much the workhorse of R. It’s basically just a list of values, mainly either numbers or characters. They’re special lists that you can do math with. You can assign this list of values to a variable, just like you would for one item. For example we can create a vector of race lengths:
race_lengths <- c(1, 5, 10)
race_lengths
A vector can also contain characters:
cities <- c("Boston", "Chicago", "San Francisco")
cities
There are many functions that allow you to inspect the content of a vector. length tells you how many elements are in a particular vector:
length(race_lengths)
length(cities)
You can also do math with whole vectors. For instance if we wanted to convert the lengths of all the races from kilometers to miles, we can do:
race_lengths * 0.621371or we can add the data in the two vectors together:
round_trips <- race_lengths + race_lengths
round_trips
This is very useful if we have data in different vectors that we want to combine or work with.
There are few ways to figure out what’s going on in a vector.
classindicates the class (the type of element) of an variable:
class(race_lengths)
class(cities)- The function
strprovides an overview of the variable and the elements it contains. It is a really useful function when working with large and complex variables:
str(race_lengths)
str(cities)
You can add elements to your vector by using the c function (c is for combine):
lengths <- c(race_lengths, 1) # adding at the end
lengths <- c(2, lengths)      # adding at the beginning
lengths
What happens here is that we take the original vector race_lengths, and we are adding another item first to the end of the other ones, and then another item at the beginning. We can do this over and over again to build a vector or a dataset.
We just saw 2 of the 6 data types that R uses: "character" and "numeric". The other 4 data types are:
"logical"forTRUEandFALSE(the boolean data type)"integer"for integer numbers (e.g.,2L, theLindicates to R that it’s an integer)"complex"to represent complex numbers with real and imaginary parts (e.g.,1+4i) and that’s all we’re going to say about them"raw"that we won’t discuss further
Vectors are one of the many data structures that R uses. Other important ones are lists (list), matrices (matrix), data frames (data.frame), and factors (factor).
Challenge
Create a vector with five numbers.
Use the
mean()function to find the mean of those numbers.What is
NAin R? Hint usehelp(NA).Create a vector with two numbers and one
NAvalue. What is the mean of this vector?
Seeking help
I know the name of the function I want to use, but I’m not sure how to use it
If you need help with a specific function, let’s say barplot(), you can type:
?barplotEach help-file contains the following components.
- Description: An extended description of what the function does.
- Usage: The arguments of the function and their default values.
- Arguments: An explanation of the data each argument is expecting.
- Details: Any important details to be aware of.
- Value: The data the function returns.
- See Also: Any related functions you might find useful.
- Examples: Some examples for how to use the function.
If you just need to remind yourself of the names of the arguments, you can use:
args(lm)If the function is part of a package that is installed on your computer but don’t remember which one, you can type:
??geom_pointI want to use a function that does X, there must be a function for it but I don’t know which one…
If you are looking for a function to do a particular task, you can use help.search() (but only looks through the installed packages):
help.search("kruskal")If you can’t find what you are looking for, you can use the rdocumention.org website that search through the help files across all packages available.
I am stuck… I get an error message that I don’t understand
Start by googling the error message. However, this doesn’t always work very well because often, package developers rely on the error catching provided by R. You end up with general error messages that might not be very helpful to diagnose a problem (e.g. “subscript out of bounds”).
However, you should check stackoverflow. Search using the [r] tag. Most questions have already been answered, but the challenge is to use the right words in the search to find the answers: http://stackoverflow.com/questions/tagged/r
The Introduction to R can also be dense for people with little programming experience but it is a good place to understand the underpinnings of the R language.
The R FAQ is dense and technical but it is full of useful information.
Asking for help
The key to get help from someone is for them to grasp your problem rapidly. You should make it as easy as possible to pinpoint where the issue might be.
- Try to use the correct words to describe your problem.
- Try to reduce what doesn’t work to a simple reproducible example.
- always include the output of
sessionInfo()
Try to use the correct words to describe your problem. For instance, a package is not the same thing as a library. Most people will understand what you meant, but others have really strong feelings about the difference in meaning. The key point is that it can make things confusing for people trying to help you. Be as precise as possible when describing your problem
Try to reduce what doesn’t work to a simple reproducible example. If you can reproduce the problem using a very small data.frame instead of your 50,000 rows and 10,000 columns one, provide the small one with the description of your problem.
For helpful info on sharing data objects with someone else, see this Asking For Help section from another R tutorial.
Always include the output of sessionInfo(). This provides critical information about your platform, the versions of R and the packages that you are using, and other information that can be very helpful to understand your problem.
sessionInfo()## R version 3.4.1 (2017-01-27)
## Platform: x86_64-pc-linux-gnu (64-bit)
## Running under: Ubuntu 14.04.5 LTS
##
## Matrix products: default
## BLAS: /home/travis/R-bin/lib/R/lib/libRblas.so
## LAPACK: /home/travis/R-bin/lib/R/lib/libRlapack.so
##
## locale:
## [1] LC_CTYPE=en_US.UTF-8 LC_NUMERIC=C
## [3] LC_TIME=en_US.UTF-8 LC_COLLATE=en_US.UTF-8
## [5] LC_MONETARY=en_US.UTF-8 LC_MESSAGES=en_US.UTF-8
## [7] LC_PAPER=en_US.UTF-8 LC_NAME=C
## [9] LC_ADDRESS=C LC_TELEPHONE=C
## [11] LC_MEASUREMENT=en_US.UTF-8 LC_IDENTIFICATION=C
##
## attached base packages:
## [1] methods stats graphics grDevices utils datasets base
##
## loaded via a namespace (and not attached):
## [1] compiler_3.4.1 backports_1.1.0 bookdown_0.4 magrittr_1.5
## [5] rprojroot_1.2 tools_3.4.1 htmltools_0.3.6 yaml_2.1.14
## [9] Rcpp_0.12.12 stringi_1.1.5 rmarkdown_1.6 blogdown_0.0.60
## [13] knitr_1.16 stringr_1.2.0 digest_0.6.12 evaluate_0.10.1Where to ask for help?
Your friendly colleagues: if you know someone with more experience than you, they might be able and willing to help you.
Google: looking for the specific error message can be helpful. But don’t use text that is way too specific. Most likely, search results will lead you to…
Stackoverlow: if your question hasn’t been answered before and is well crafted, chances are you will get an answer in less than 5 min.
The R-help: it is read by a lot of people (including most of the R core team), a lot of people post to it, but the tone can be pretty dry, and it is not always very welcoming to new users. If your question is valid, you are likely to get an answer very fast but don’t expect that it will come with smiley faces. Also, here more than everywhere else, be sure to use correct vocabulary (otherwise you might get an answer pointing to the misuse of your words rather than answering your question). You will also have more success if your question is about a base function rather than a specific package.
If your question is about a specific package, see if there is a mailing list for it. Usually it’s included in the DESCRIPTION file of the package that can be accessed using
packageDescription("name-of-package"). You may also want to try to email the author of the package directly.There are also some topic-specific mailing lists (GIS, phylogenetics, etc…), the complete list is here.
More resources
- The Posting Guide for the R mailing lists.
- How to ask for R help useful guidelines